| Overall | 7W 11L 2T |
| District | 0W 5L 1T |
| Expected | 14: 3+ 3- |
":" = Games won or lost as expected,
"+" = Games won against stronger team,
"-" = Games lost against weaker team)
|
49 12 4 Rank in State, Class, District |
890 -199 Strength Momentum |
936 40.6(56) SOS, RPI(RPI Rank) |
":" = Games won or lost as expected, "+" = Games won against stronger team, "-" = Games lost against weaker team) | |
| Date | Opponent1 | RGWF4 | Opp Strength | Result | Expectation2 | Playing Strength | P(Win)3 | Send |
|---|---|---|---|---|---|---|---|---|
| 08/18/15 | Socorro | 0.000 | 1040 | L 0- 6 | Expected (-5) | 651 | 29% |  |
| 08/21/15 | at Monte del Sol | 0.000 | 844 | T 2- 2 | Worse (0) | 877 | 55% | |
| 08/22/15 | Hatch | 0.000 | 1052 | L 0- 1 | Expected (0) | 911 | 27% | |
| 08/22/15 | Silver | 0.000 | 870 | W 2- 1 | Expected (+1) | 920 | 57% | |
| 08/25/15 | at Monte del Sol | 0.000 | 844 | W 2- 0 | Expected (+2) | 977 | 55% | |
| 08/31/15 | at Socorro | 0.000 | 1040 | L 1- 7 | Expected (-4) | 671 | 24% | |
| 09/05/15 | Santa Fe Prep !! | 0.002 | 1111 | W 4- 3 | Better (+3) | 1041 | 19% | |
| 09/10/15 | Gallup | 0.002 | 579 | W 7- 1 | Expected (+3) | 1029 | 90% | |
| 09/15/15 | Robertson | 0.010 | 872 | W 4- 1 | Expected (+3) | 1022 | 56% | |
| 09/17/15 | at Hatch | 0.016 | 1052 | L 1- 3 | Expected (0) | 881 | 22% | |
| 09/24/15 | at Ruidoso | 0.047 | 950 | L 2- 3 | Expected (0) | 880 | 36% | |
| 09/29/15 | Hatch | 0.068 | 1052 | L 0- 3 | Expected (-2) | 811 | 27% | |
| 10/03/15 | NMMI ? | 0.068 | 909 | L 1- 6 | Worse (-5) | 637 | 50% | |
| 10/06/15 | Bernalillo | 0.173 | 884 | L 0- 2 | Worse (-2) | 777 | 54% | |
| 10/09/15 | at Portales | 0.222 | 936 | L 0- 3 | Expected (-2) | 772 | 39% | |
| 10/13/15 | Bloomfield | 0.370 | 729 | W 3- 2 | Expected (-1) | 850 | 78% | |
| 10/15/15 | at NMMI ?? | 0.187 | 909 | L 2- 8 | Expected (-6) | 605 | 43% | |
| 10/19/15 | Ruidoso | 0.420 | 950 | L 2- 5 | Expected (-3) | 760 | 43% | |
| 10/22/15 | Rehoboth Christian ! | 0.661 | 1003 | W 3- 2 | Better (+2) | 987 | 34% | |
| 10/24/15 | Portales | 0.732 | 936 | T 1- 1 | Better (0) | 903 | 45% | |
|
Notes: 1Games against an opponent in the same district are shown in bold letters; may NOT be an actual district game Numbers in parentheses for reported games are the goals East Mountain actually scored, relative to what ratings predicted 2Numbers listed for unreported/future games are the most probable winning margin 3P(Win) is the expected winning Percentage -- the statistical success rate for predicting the game winner between teams of this strength difference 4RGWF is the relative weight factor for this game * Game at a neutral site, or unable to determine which team gets home field advantage |
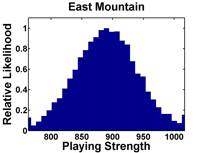
The median opponent strength is 936, while
East Mountain's "weighted playing strength" is 851
(where a win by 4 goals counts 0.65 as much as a 1 goal win, and
a game played on 10/17/15 counts 0.5 that of one played on 11/07/15)
Go back to ratings for Boys Varsity Girls Varsity Main Page